Local real estate rules require that you sign in or register to view certain information on this website, such as sold information and information related to some listings.
You agree to receive marketing and customer service calls and text messages from Move With Manoj. Consent is not a condition of purchase. Message/data rates may apply. Message frequency varies. You may Reply STOP to unsubscribe at any time.
Clarington House Prices: Market Stats by Home Type (October 2026)
Nov 17
Thinking about buying or selling in Clarington? Here's what homes actually sold for in October 2026, broken down by type of home, plus how prices have moved every month since 2021. I update this page every month, so bookmark it and check back.
Homes sold in Oct?How many detached houses sold in Clarington in October. More sales means a busier market.
77
Oct 2025: 75 sold
Days to sell?The average number of days from the day a home is listed to the day it sells. Fewer days means homes are selling faster.
22 days
Last year: 31 days
Sells for?On average, homes sold for 99% of their asking price. Example: a home listed at $1,000,000 sold for about $990,000. Under 100% means buyers are paying less than the asking price.
99%
of the asking price
Active homes for sale?Homes listed for sale today that haven't sold yet. The more homes for sale, the more choice buyers have.
318
for sale right now
Buyer's or seller's market??Months of inventory: if no new homes came up for sale, how many months it would take to sell every home listed right now. Under 4 months favours sellers, 4 to 6 is balanced, and over 6 favours buyers.
4 monthsof inventoryBalanced market
Seller'sBalancedBuyer's
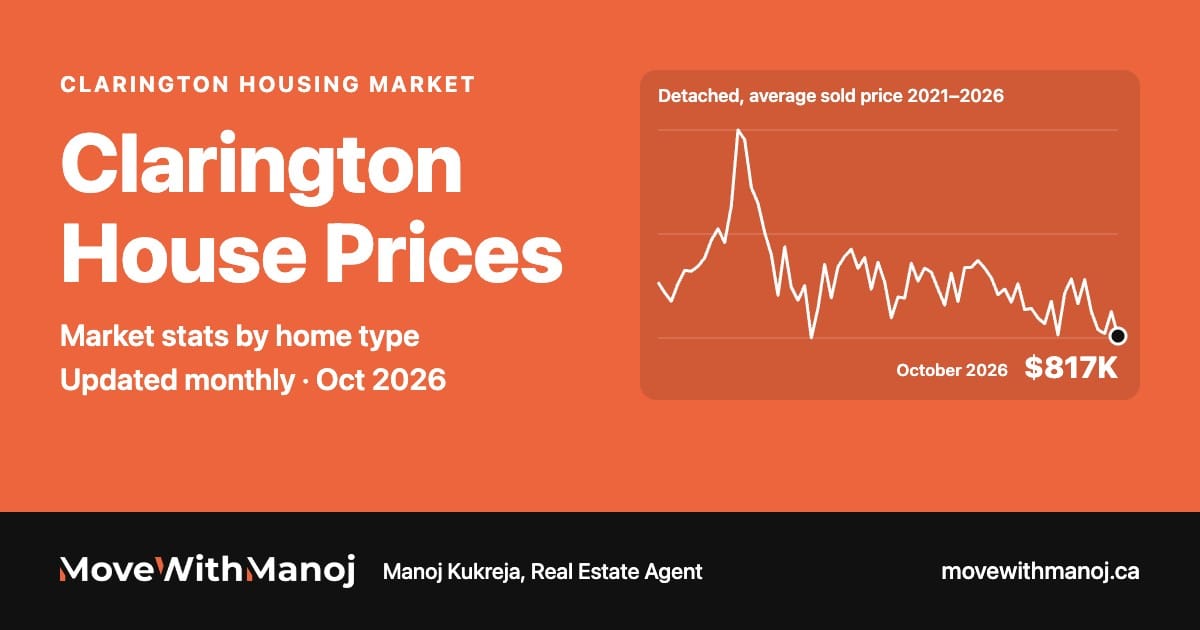
Detached houses in Clarington sold for about 5% less than a year ago. 77 sold in October, up from 75 a year earlier. They're taking about 22 days to sell, a little faster than last year. Homes are going for about 99% of the asking price, so well-priced homes still sell close to asking.
movewithmanoj.ca
Clarington detached houses: average sold price
Every month since January 2021. Point at (or tap) the line to see any month.
$800K
$1M
$1.2M
$1.4M
Jan 2021$938,08679 homes sold
Feb 2021$914,585191 homes sold
Mar 2021$895,230285 homes sold
Apr 2021$934,611236 homes sold
May 2021$964,561199 homes sold
Jun 2021$962,495149 homes sold
Jul 2021$973,453146 homes sold
Aug 2021$992,232140 homes sold
Sep 2021$1,031,984131 homes sold
Oct 2021$1,057,654116 homes sold
Nov 2021$1,026,759122 homes sold
Dec 2021$1,108,92287 homes sold
Jan 2022$1,278,86965 homes sold
Feb 2022$1,257,254147 homes sold
Mar 2022$1,150,182190 homes sold
Apr 2022$1,114,819162 homes sold
May 2022$1,049,529138 homes sold
Jun 2022$999,478138 homes sold
Jul 2022$908,372107 homes sold
Aug 2022$1,017,192112 homes sold
Sep 2022$926,25594 homes sold
Oct 2022$897,31880 homes sold
Nov 2022$930,18880 homes sold
Dec 2022$812,95746 homes sold
Jan 2023$879,54048 homes sold
Feb 2023$977,81772 homes sold
Mar 2023$902,94890 homes sold
Apr 2023$972,411111 homes sold
May 2023$995,761133 homes sold
Jun 2023$1,011,994122 homes sold
Jul 2023$968,795119 homes sold
Aug 2023$992,88380 homes sold
Sep 2023$922,19878 homes sold
Oct 2023$982,67276 homes sold
Nov 2023$938,50557 homes sold
Dec 2023$858,26945 homes sold
Jan 2024$904,68154 homes sold
Feb 2024$902,498104 homes sold
Mar 2024$980,38297 homes sold
Apr 2024$940,389118 homes sold
May 2024$969,489119 homes sold
Jun 2024$960,434113 homes sold
Jul 2024$923,05998 homes sold
Aug 2024$886,75290 homes sold
Sep 2024$958,50983 homes sold
Oct 2024$894,573109 homes sold
Nov 2024$970,48187 homes sold
Dec 2024$971,25729 homes sold
Jan 2025$986,58836 homes sold
Feb 2025$969,38069 homes sold
Mar 2025$948,01087 homes sold
Apr 2025$909,79183 homes sold
May 2025$922,66094 homes sold
Jun 2025$892,98287 homes sold
Jul 2025$934,812119 homes sold
Aug 2025$876,51478 homes sold
Sep 2025$879,21495 homes sold
Oct 2025$857,97375 homes sold
Nov 2025$844,69974 homes sold
Dec 2025$895,17158 homes sold
Jan 2026$820,13236 homes sold
Feb 2026$913,08938 homes sold
Mar 2026$945,26761 homes sold
Apr 2026$889,79579 homes sold
May 2026$943,76794 homes sold
Jun 2026$872,284107 homes sold
Jul 2026$831,69094 homes sold
Aug 2026$822,81461 homes sold
Sep 2026$872,15676 homes sold
Oct 2026$817,32777 homes sold
202120222023202420252026
Chart by Manoj Kukreja, Move With Manoj · movewithmanoj.ca
Homes sold in Oct?How many semi-detached houses sold in Clarington in October. More sales means a busier market.
3
Oct 2025: 1 sold
Days to sell?The average number of days from the day a home is listed to the day it sells. Fewer days means homes are selling faster.
31 days
Last year: 10 days
Sells for?On average, homes sold for 95% of their asking price. Example: a home listed at $1,000,000 sold for about $950,000. Under 100% means buyers are paying less than the asking price.
95%
of the asking price
Active homes for sale?Homes listed for sale today that haven't sold yet. The more homes for sale, the more choice buyers have.
8
for sale right now
Buyer's or seller's market??Months of inventory: if no new homes came up for sale, how many months it would take to sell every home listed right now. Under 4 months favours sellers, 4 to 6 is balanced, and over 6 favours buyers.
2.7 monthsof inventorySeller's market
Seller'sBalancedBuyer's
Semi-detached houses in Clarington sold for about 14% less than a year ago. Only 3 sold in October, so one or two sales can move the average a lot. They're taking about 31 days to sell, a little longer than last year. Homes are going for about 95% of the asking price, so buyers have some room to negotiate.
movewithmanoj.ca
Clarington semi-detached houses: average sold price
Every month since January 2021. Point at (or tap) the line to see any month.
$400K
$600K
$800K
$1M
$1.2M
Jan 2021$681,6673 homes sold
Feb 2021$717,4449 homes sold
Mar 2021$644,18715 homes sold
Apr 2021$617,1508 homes sold
May 2021$649,04010 homes sold
Jun 2021$664,9388 homes sold
Jul 2021$717,8005 homes sold
Aug 2021$739,7003 homes sold
Sep 2021$700,1007 homes sold
Oct 2021$823,2005 homes sold
Nov 2021$818,5836 homes sold
Dec 2021$797,4176 homes sold
Jan 2022$1,014,2504 homes sold
Feb 2022$901,2504 homes sold
Mar 2022$739,0005 homes sold
Apr 2022$804,8758 homes sold
May 2022$735,0007 homes sold
Jun 2022$622,1676 homes sold
Jul 2022$625,0002 homes sold
Aug 2022$622,4005 homes sold
Sep 2022$758,0005 homes sold
Oct 2022$778,3333 homes sold
Nov 2022$680,0002 homes sold
Dec 2022$648,7502 homes sold
Jan 2023No sales
Feb 2023$771,2147 homes sold
Mar 2023$741,0673 homes sold
Apr 2023$708,3333 homes sold
May 2023$785,3333 homes sold
Jun 2023$768,6437 homes sold
Jul 2023$744,0005 homes sold
Aug 2023$738,4147 homes sold
Sep 2023$725,0004 homes sold
Oct 2023$660,0001 home sold
Nov 2023$625,0001 home sold
Dec 2023$725,6673 homes sold
Jan 2024$722,5002 homes sold
Feb 2024$645,0144 homes sold
Mar 2024$780,3336 homes sold
Apr 2024$713,6388 homes sold
May 2024$625,8333 homes sold
Jun 2024$741,10010 homes sold
Jul 2024$691,6673 homes sold
Aug 2024No sales
Sep 2024$831,5805 homes sold
Oct 2024$733,7875 homes sold
Nov 2024$701,0333 homes sold
Dec 2024$795,0003 homes sold
Jan 2025$596,6673 homes sold
Feb 2025$694,2502 homes sold
Mar 2025$676,7636 homes sold
Apr 2025$695,0001 home sold
May 2025$665,8005 homes sold
Jun 2025$682,9466 homes sold
Jul 2025$840,0001 home sold
Aug 2025$713,6258 homes sold
Sep 2025$627,5002 homes sold
Oct 2025$690,0001 home sold
Nov 2025$697,5002 homes sold
Dec 2025$672,2506 homes sold
Jan 2026$642,5002 homes sold
Feb 2026$600,7002 homes sold
Mar 2026$643,2005 homes sold
Apr 2026$613,9388 homes sold
May 2026$596,1673 homes sold
Jun 2026$639,0005 homes sold
Jul 2026$580,0002 homes sold
Aug 2026$586,6673 homes sold
Sep 2026$661,3333 homes sold
Oct 2026$593,3333 homes sold
202120222023202420252026
Chart by Manoj Kukreja, Move With Manoj · movewithmanoj.ca
Homes sold in Oct?How many freehold townhouses sold in Clarington in October. More sales means a busier market.
16
Oct 2025: 12 sold
Days to sell?The average number of days from the day a home is listed to the day it sells. Fewer days means homes are selling faster.
32 days
Last year: 20 days
Sells for?On average, homes sold for 98% of their asking price. Example: a home listed at $1,000,000 sold for about $980,000. Under 100% means buyers are paying less than the asking price.
98%
of the asking price
Active homes for sale?Homes listed for sale today that haven't sold yet. The more homes for sale, the more choice buyers have.
57
for sale right now
Buyer's or seller's market??Months of inventory: if no new homes came up for sale, how many months it would take to sell every home listed right now. Under 4 months favours sellers, 4 to 6 is balanced, and over 6 favours buyers.
3.2 monthsof inventorySeller's market
Seller'sBalancedBuyer's
Freehold townhouses in Clarington sold for about 8% less than a year ago. 16 sold in October, up from 12 a year earlier. They're taking about 32 days to sell, a little longer than last year. Homes are going for about 98% of the asking price, so well-priced homes still sell close to asking.
movewithmanoj.ca
Clarington freehold townhouses: average sold price
Every month since January 2021. Point at (or tap) the line to see any month.
$600K
$700K
$800K
$900K
$1M
Jan 2021$716,18616 homes sold
Feb 2021$742,15437 homes sold
Mar 2021$714,55358 homes sold
Apr 2021$740,71345 homes sold
May 2021$700,18840 homes sold
Jun 2021$735,83331 homes sold
Jul 2021$742,31726 homes sold
Aug 2021$747,85020 homes sold
Sep 2021$782,61225 homes sold
Oct 2021$834,42326 homes sold
Nov 2021$845,78015 homes sold
Dec 2021$887,63315 homes sold
Jan 2022$933,35317 homes sold
Feb 2022$981,93228 homes sold
Mar 2022$925,26435 homes sold
Apr 2022$837,82131 homes sold
May 2022$810,43924 homes sold
Jun 2022$777,63315 homes sold
Jul 2022$730,09111 homes sold
Aug 2022$769,20012 homes sold
Sep 2022$705,89010 homes sold
Oct 2022$727,70714 homes sold
Nov 2022$730,95511 homes sold
Dec 2022$720,80411 homes sold
Jan 2023$742,5008 homes sold
Feb 2023$733,32712 homes sold
Mar 2023$777,59926 homes sold
Apr 2023$778,14717 homes sold
May 2023$815,65322 homes sold
Jun 2023$827,97919 homes sold
Jul 2023$782,10016 homes sold
Aug 2023$772,55622 homes sold
Sep 2023$753,80921 homes sold
Oct 2023$716,50013 homes sold
Nov 2023$713,66121 homes sold
Dec 2023$726,17311 homes sold
Jan 2024$777,33312 homes sold
Feb 2024$771,07625 homes sold
Mar 2024$781,93423 homes sold
Apr 2024$772,61322 homes sold
May 2024$761,72218 homes sold
Jun 2024$765,33321 homes sold
Jul 2024$739,94418 homes sold
Aug 2024$722,09316 homes sold
Sep 2024$736,30423 homes sold
Oct 2024$720,61916 homes sold
Nov 2024$732,24519 homes sold
Dec 2024$735,0005 homes sold
Jan 2025$754,83312 homes sold
Feb 2025$732,94411 homes sold
Mar 2025$785,64212 homes sold
Apr 2025$728,03312 homes sold
May 2025$710,10922 homes sold
Jun 2025$716,82224 homes sold
Jul 2025$693,62516 homes sold
Aug 2025$696,58113 homes sold
Sep 2025$692,99213 homes sold
Oct 2025$704,28312 homes sold
Nov 2025$702,79315 homes sold
Dec 2025$679,99312 homes sold
Jan 2026$647,04511 homes sold
Feb 2026$672,2119 homes sold
Mar 2026$673,99212 homes sold
Apr 2026$666,14314 homes sold
May 2026$633,63020 homes sold
Jun 2026$647,10922 homes sold
Jul 2026$650,68713 homes sold
Aug 2026$662,58015 homes sold
Sep 2026$646,86715 homes sold
Oct 2026$651,13116 homes sold
202120222023202420252026
Chart by Manoj Kukreja, Move With Manoj · movewithmanoj.ca
Homes sold in Oct?How many condo townhouses sold in Clarington in October. More sales means a busier market.
5
Oct 2025: 4 sold
Days to sell?The average number of days from the day a home is listed to the day it sells. Fewer days means homes are selling faster.
49 days
Last year: 61 days
Sells for?On average, homes sold for 96% of their asking price. Example: a home listed at $1,000,000 sold for about $960,000. Under 100% means buyers are paying less than the asking price.
96%
of the asking price
Active homes for sale?Homes listed for sale today that haven't sold yet. The more homes for sale, the more choice buyers have.
26
for sale right now
Buyer's or seller's market??Months of inventory: if no new homes came up for sale, how many months it would take to sell every home listed right now. Under 4 months favours sellers, 4 to 6 is balanced, and over 6 favours buyers.
4.3 monthsof inventoryBalanced market
Seller'sBalancedBuyer's
Condo townhouses in Clarington sold for about 16% less than a year ago. Only 5 sold in October, so one or two sales can move the average a lot. They're taking about 49 days to sell, a little faster than last year. Homes are going for about 96% of the asking price, so buyers have some room to negotiate.
movewithmanoj.ca
Clarington condo townhouses: average sold price
Every month since January 2021. Point at (or tap) the line to see any month.
$250K
$500K
$750K
$1M
$1.25M
$1.5M
Jan 2021$796,6673 homes sold
Feb 2021$555,6066 homes sold
Mar 2021$596,29513 homes sold
Apr 2021$588,50012 homes sold
May 2021$706,7577 homes sold
Jun 2021$575,4005 homes sold
Jul 2021$646,1676 homes sold
Aug 2021$743,5755 homes sold
Sep 2021$642,5004 homes sold
Oct 2021$697,9905 homes sold
Nov 2021$715,1297 homes sold
Dec 2021$1,385,0001 home sold
Jan 2022$797,8752 homes sold
Feb 2022$859,1673 homes sold
Mar 2022$786,2867 homes sold
Apr 2022$877,0004 homes sold
May 2022$835,6005 homes sold
Jun 2022$624,2504 homes sold
Jul 2022$605,3333 homes sold
Aug 2022$717,7147 homes sold
Sep 2022$562,9673 homes sold
Oct 2022$742,5006 homes sold
Nov 2022$650,0001 home sold
Dec 2022$639,1005 homes sold
Jan 2023$550,0001 home sold
Feb 2023$755,2206 homes sold
Mar 2023$672,0005 homes sold
Apr 2023$832,1254 homes sold
May 2023$676,2867 homes sold
Jun 2023$666,1676 homes sold
Jul 2023$651,9985 homes sold
Aug 2023$648,2577 homes sold
Sep 2023$685,5002 homes sold
Oct 2023$720,0002 homes sold
Nov 2023$720,0001 home sold
Dec 2023$720,5002 homes sold
Jan 2024$641,6673 homes sold
Feb 2024$628,1407 homes sold
Mar 2024$616,7504 homes sold
Apr 2024$591,7506 homes sold
May 2024$625,6673 homes sold
Jun 2024$645,0001 home sold
Jul 2024$691,5005 homes sold
Aug 2024$667,3336 homes sold
Sep 2024$635,0004 homes sold
Oct 2024$569,2789 homes sold
Nov 2024$799,9754 homes sold
Dec 2024No sales
Jan 2025$580,0002 homes sold
Feb 2025$840,0003 homes sold
Mar 2025$1,102,5002 homes sold
Apr 2025$673,7504 homes sold
May 2025$824,1005 homes sold
Jun 2025$613,9836 homes sold
Jul 2025$614,8577 homes sold
Aug 2025$533,9985 homes sold
Sep 2025$551,3805 homes sold
Oct 2025$569,3754 homes sold
Nov 2025$515,3333 homes sold
Dec 2025$552,5002 homes sold
Jan 2026$584,8754 homes sold
Feb 2026$527,7506 homes sold
Mar 2026$593,5002 homes sold
Apr 2026$532,7504 homes sold
May 2026$492,5004 homes sold
Jun 2026$528,9754 homes sold
Jul 2026$524,5004 homes sold
Aug 2026No sales
Sep 2026$541,5004 homes sold
Oct 2026$478,8005 homes sold
202120222023202420252026
Chart by Manoj Kukreja, Move With Manoj · movewithmanoj.ca
Homes sold in Oct?How many condo apartments sold in Clarington in October. More sales means a busier market.
8
Oct 2025: 8 sold
Days to sell?The average number of days from the day a home is listed to the day it sells. Fewer days means homes are selling faster.
33 days
1- and 2-bedroom condos
Sells for?On average, homes sold for 97% of their asking price. Example: a home listed at $1,000,000 sold for about $970,000. Under 100% means buyers are paying less than the asking price.
97%
of the asking price
Active homes for sale?Homes listed for sale today that haven't sold yet. The more homes for sale, the more choice buyers have.
38
for sale right now
Buyer's or seller's market??Months of inventory: if no new homes came up for sale, how many months it would take to sell every home listed right now. Under 4 months favours sellers, 4 to 6 is balanced, and over 6 favours buyers.
Condo prices change with the mix of units that sell each month, so the trend line tells you more than any single month. Right now a 1-bedroom condo averages $404,000 and a 2-bedroom averages $459,765.
movewithmanoj.ca
Clarington condo apartments: average sold price
Every month since January 2021. Point at (or tap) the line to see any month.
$400K
$500K
$600K
$700K
Jan 2021$524,4297 homes sold
Feb 2021$466,29010 homes sold
Mar 2021$482,61418 homes sold
Apr 2021$533,05219 homes sold
May 2021$523,93813 homes sold
Jun 2021$530,73414 homes sold
Jul 2021$498,05413 homes sold
Aug 2021$506,94219 homes sold
Sep 2021$562,82213 homes sold
Oct 2021$556,78614 homes sold
Nov 2021$582,19915 homes sold
Dec 2021$568,25010 homes sold
Jan 2022$562,3876 homes sold
Feb 2022$666,17814 homes sold
Mar 2022$656,28111 homes sold
Apr 2022$655,92914 homes sold
May 2022$597,14314 homes sold
Jun 2022$626,6119 homes sold
Jul 2022$537,55010 homes sold
Aug 2022$540,07512 homes sold
Sep 2022$536,53718 homes sold
Oct 2022$560,2789 homes sold
Nov 2022$487,4089 homes sold
Dec 2022$546,3577 homes sold
Jan 2023$535,5805 homes sold
Feb 2023$510,7508 homes sold
Mar 2023$575,72711 homes sold
Apr 2023$592,77920 homes sold
May 2023$538,96715 homes sold
Jun 2023$557,57211 homes sold
Jul 2023$557,67013 homes sold
Aug 2023$571,96414 homes sold
Sep 2023$617,99010 homes sold
Oct 2023$627,8417 homes sold
Nov 2023$504,7789 homes sold
Dec 2023$455,0003 homes sold
Jan 2024$502,5006 homes sold
Feb 2024$543,11712 homes sold
Mar 2024$573,47716 homes sold
Apr 2024$563,71916 homes sold
May 2024$523,6254 homes sold
Jun 2024$627,1258 homes sold
Jul 2024$520,79010 homes sold
Aug 2024$521,0004 homes sold
Sep 2024$521,11513 homes sold
Oct 2024$530,50011 homes sold
Nov 2024$512,6005 homes sold
Dec 2024$496,6333 homes sold
Jan 2025$506,8756 homes sold
Feb 2025$626,0007 homes sold
Mar 2025$602,5006 homes sold
Apr 2025$502,2005 homes sold
May 2025$506,08312 homes sold
Jun 2025$524,6679 homes sold
Jul 2025$466,65616 homes sold
Aug 2025$506,80010 homes sold
Sep 2025$566,0003 homes sold
Oct 2025$481,0008 homes sold
Nov 2025$409,5638 homes sold
Dec 2025$456,83813 homes sold
Jan 2026$431,5005 homes sold
Feb 2026$468,3333 homes sold
Mar 2026$483,27311 homes sold
Apr 2026$485,66612 homes sold
May 2026$470,99111 homes sold
Jun 2026$519,95412 homes sold
Jul 2026$449,56715 homes sold
Aug 2026$481,85714 homes sold
Sep 2026$432,2229 homes sold
Oct 2026$438,8538 homes sold
202120222023202420252026
Chart by Manoj Kukreja, Move With Manoj · movewithmanoj.ca
Thinking about renting, or buying a place to rent out? Here's what Clarington condos and condo townhouses leased for, on average, from July to September 2026.
1-bedroom condo
$2,053 /month
38 leased
2-bedroom condo
$2,458 /month
29 leased
Buy or rent? In October 2026, a 1-bedroom condo in Clarington sold for about $404,000, or rents for about $2,053 a month. A 2-bedroom sold for about $460,000, or rents for about $2,458 a month.
Rents come from TRREB's quarterly rental report and are updated every three months. Looking for a place? See Clarington homes for lease.
What this means for you
If you're buying: there's a fair amount of choice and most homes aren't selling overnight, so you have time to compare and some room to negotiate.
If you're selling: pricing right from day one matters more than ever. Homes that are priced well still sell, while overpriced ones sit. The first step is knowing what your home is worth today.
What's your Clarington home worth?
Get a free home evaluation based on what's actually selling on your street. No pressure, no obligation.
It depends on the type of home. In October 2026, the average sold price in Clarington was $817,327 for a detached house, $593,333 for a semi-detached house, $651,131 for a freehold townhouse, $478,800 for a condo townhouse and $438,853 for a condo apartment.
Are house prices going down in Clarington?
Compared with October 2025, detached houses were down about 5%, semi-detached houses were down about 14%, freehold townhouses were down about 8%, condo townhouses were down about 16% and condo apartments were down about 9%. The average detached price is about 36% below its peak of $1.28M in January 2022.
Is Clarington a buyer's or seller's market right now?
Balanced for detached homes, with about 4 months of inventory. Under 4 months favours sellers, 4 to 6 is balanced and over 6 favours buyers.
How long does it take to sell a house in Clarington?
In October 2026, it took about 22 days for a detached house, 31 days for a semi-detached house, 32 days for a freehold townhouse and 49 days for a condo townhouse.
What is the average rent in Clarington?
From July to September 2026, the average monthly rent in Clarington was $2,053 for a 1-bedroom condo and $2,458 for a 2-bedroom condo.
Where do these numbers come from?
Average sold prices and the number of homes sold come from the Toronto Regional Real Estate Board's monthly Market Watch report. Days to sell, homes for sale and the share of asking price come from Clarington listings on movewithmanoj.ca. This page is updated every month.
This page uses two sources, and it is updated every month once the new numbers come out.
Average sold price and homes sold come from the Toronto Regional Real Estate Board (TRREB) Market Watch report. A home counts in the month its sale became firm, meaning the buyer and seller both signed and all conditions were removed, not the month it closed.
Average sold price is the total value of all sales of that type of home in Clarington that month, divided by the number of homes sold. Each type of home is counted on its own, so a condo never pulls down the detached average.
Days to sell, active homes for sale, share of the asking price and the buyer's or seller's market reading come from Clarington listings on movewithmanoj.ca for October 2026.
Average rents come from TRREB's quarterly Rental Market Report (Q3 2026): the average monthly rent of condo apartments and condo townhouses leased through TRREB's MLS® System. TRREB doesn't report rents for detached and semi-detached houses.
Why averages jump around: an average moves when prices change, but also when a different mix of homes sells. A month with a few large luxury sales pushes the average up even if most prices didn't move. Types of home with only a handful of sales can swing a lot from month to month, so the long-term trend in each chart tells you more than any single month.
Your privacy is of the utmost importance to us. Below, we explain how we use the information you provide us with. Changes may be made to our privacy policy in the future, we recommend that you periodically review it.
Your Data
Data will not be sold or shared with third parties for promotional or marketing purposes.
Your Name
We use your name for no reason other than to greet you when we send you a message on behalf of your real estate agent.
Your Email Address
We use your email address to email you messages on behalf of your real estate agent. If your preference is not to receive email messages you may turn off email notifications in your preferences. If you wish to unsubscribe from receiving future messages from us on behalf of your real estate agent you may click unsubscribe at the bottom of any email you receive.
Your Phone Number
We use your phone number to text you messages on behalf of your real estate agent. If your preference is not to receive text messages you may turn off text notifications in your preferences. If you wish to unsubscribe from receiving future messages from us on behalf of your real estate agent you may text STOP in response to any text message you receive.
Your Search Preferences
Your real estate agent provides us with your search preferences. We use this information to inform you of new listings that you may be interested in. You may delete your search preferences at any time by clicking filters.
Properties You've Viewed
We keep track of the properties that you view. This helps us understand what properties you're interested in so that we may keep you informed when the property information changes. We also allow your real estate agent to see what properties you've viewed so that they may better serve you.
Properties You've Liked
We keep track of the properties that you've liked. This is for your convenience. We also allow your real estate agent to view properties you've liked so that they may better serve you.
Properties You've Disliked
We keep track of the properties that you've disliked. We also allow your real estate agent to view properties you've disliked so that they may better serve you.
Messages and Conversations
Messages and conversations between you and your real estate agent may be viewed by other members of your real estate agent's team.
Cookies
We use cookies to improve your experience. Cookies allow us to keep you logged in so that you don't have to provide a username and password each time you visit this website.
Your Real Estate Agent
Your real estate agent is required to abide by the Privacy Code of the Canadian Real Estate Association. For specific information, please view the following PDF:
http://www.mcsres.com/shared/PrivacyPolicy.pdf
Please read this agreement carefully before using this website or accessing services offered through this website. In using this website, you agree to the Terms of Use and acknowledge that it's your responsibility to periodically review the Terms of Use for changes and amendments.
Visitors of this website
In using this website or services offered by this website, you are entering into a lawful broker-consumer relationship with Century 21 People’s Choice Realty Inc., Brokerage.
This website and its services are intended for use by non-commercial buyers and sellers of Real Estate. You must have a bona fide interest in the purchase, sale, or lease of real estate of the type being offered through this website. Any commercial use of this website, and/or its services is strictly prohibited unless otherwise authorized in writing by Century 21 People’s Choice Realty Inc., Brokerage.
You use this website and the services offered by this website at your own risk. The content on this website and the services offered by this website are provided "as is" without warranty. In no circumstance will Century 21 People’s Choice Realty Inc., Brokerage, be held liable for damages of any kind arising from the use of this website or services offered by this website.
This website, including its content, and design may not be reproduced or distributed in any form. All content on this website is owned by Century 21 People’s Choice Realty Inc., Brokerage, and all rights are reserved.
You may not, directly or indirectly, display, post, disseminate, distribute, publish, broadcast, transfer, sell or sublicense any Listing Information to another individual or entity. The prohibited uses expressly include “scraping” (including “screen scraping” and “database scraping”), “data mining” or any other activity intended to collect, store, re-organize, summarize or manipulate any Listing Information or any related data.
You may not copy, redistribute, retransmit, or otherwise use any of the data or Listing Information provided, except in connection with your consideration of the purchase or sale of an individual property.
You acknowledge TRREB’s ownership of, and the validity of TRREB’s proprietary rights and copyright in, the MLS® database, TRREB’s MLS® System, Listing Information, and any related information.
TRREB, and other Members of TRREB or their duly authorized representatives may access this website for the purposes of verifying compliance with MLS® Rules and Policies (including the VOW Rules) and monitoring the display of Members’ Listings by the VOW.
You acknowledge ITSO's ownership of, and the validity of ITSO's proprietary rights and copyright in, the MLS® database, ITSO's MLS® System, Listing Information and any related information.
ITSO, and other Members of ITSO or their duly authorized representatives may access this website for the purposes of verifying compliance with MLS® Rules and Policies (including the VOW Rules) and monitoring the display of Members' Listings by the VOW.

 movewithmanoj.ca
 See detached homes for sale in ClaringtonView listings →Own a detached house in Clarington? Find out what it's worth today.Free home evaluation based on recent Clarington sales. No pressure, no obligation.Get my free home evaluation →

Comments